
Part 1: Enhancing User Engagement Measurement on SharePoint Intranets with Power Platform
Oct 21, 2023 • 3 • 464
Table of contents
Measuring user engagement is crucial for any SharePoint-based intranet to ensure that the platform is meeting its intended purpose and delivering value to the users. You can already benefit from Viva Connections and Viva Insights to enhance the user engagement measurement capabilities.
In the first part of this blog serie, we will explore how to use the Power Platform to measure user engagement even more deeply using KPI’s regarding user engagement.
Part 2 of this blog serie will cover the KPI regarding page freshness.
Part 3 will cover how to visualize the collected data in Power BI to gain insights into user behavior and engagement patterns. We will walk through the creation of a dashboard that displays the engagement metrics in a clear and concise manner, allowing intranet administrators to quickly assess the intranet’s effectiveness and identify areas for improvement.
Step by step
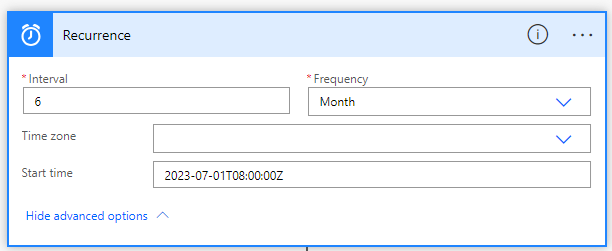
Trigger
Create a flow which is triggered by once per 6 months, so half yearly calculations can be made.
Initialize variables
Initialize variables URL, varYear, varHalfYear and set the half year value dynamically.
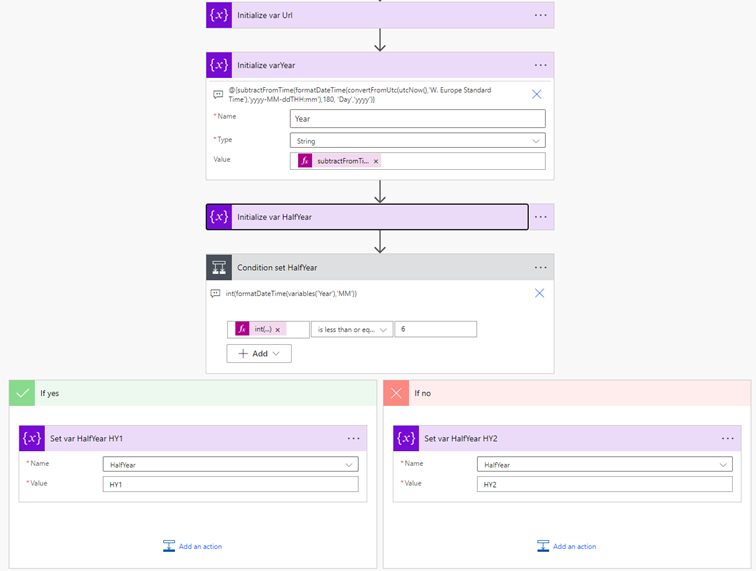
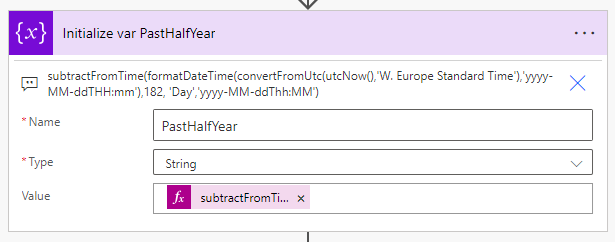
The date of the past half year can be detracted by using this expression:
subtractFromTime(formatDateTime(convertFromUtc(utcNow(),'W. Europe Standard Time'),'yyyy-MM-ddTHH:mm'),182, 'Day','yyyy-MM-ddThh:MM')
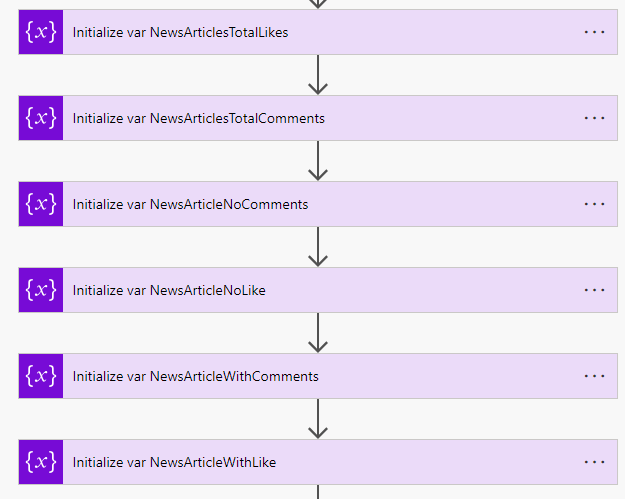
Initialize all those variables as integer:
- NewsArticlesTotalLikes
- NewsArticlesTotalComments
- NewsArticleNoComments
- NewsArticleNoLike
- NewsArticleWithComments
- NewsArticleWithLike
HTTP request to SharePoint
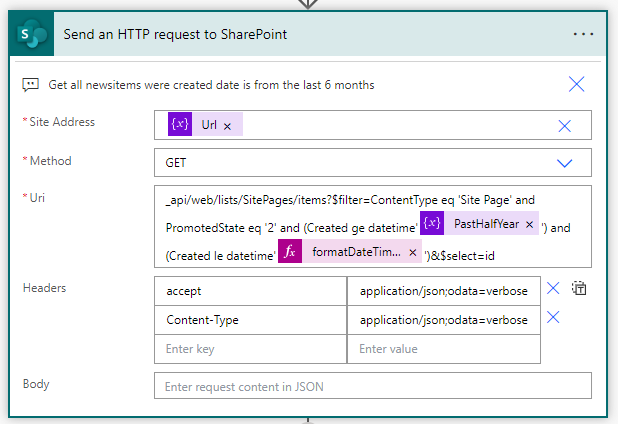
Send an HTTP to SharePoint using this URI to get alle newsitems that were created in the last 6 months and the ‘id’ is selected.
_api/web/lists/SitePages/items?$filter=ContentType eq 'Site Page' and PromotedState eq '2' and (Created ge datetime'@{variables('PastHalfYear')}') and (Created le datetime'@{formatDateTime(utcNow(),'yyyy-MM-ddThh:MM')}')&$select=id
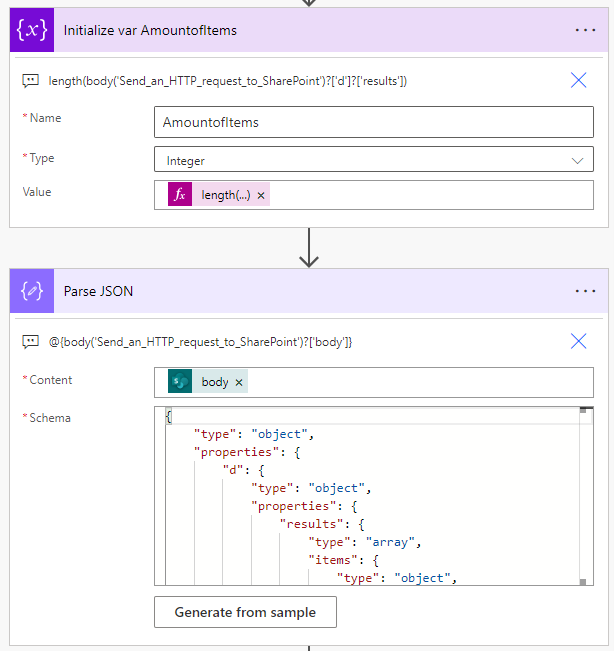
Count the total amount of items retrieved in the last step. And add a Parse JSON and use the body of the HTTP request.
Apply to each newsitem
The output will be used in the apply to each, so the statistics of each newsitem can be calculated correctly.
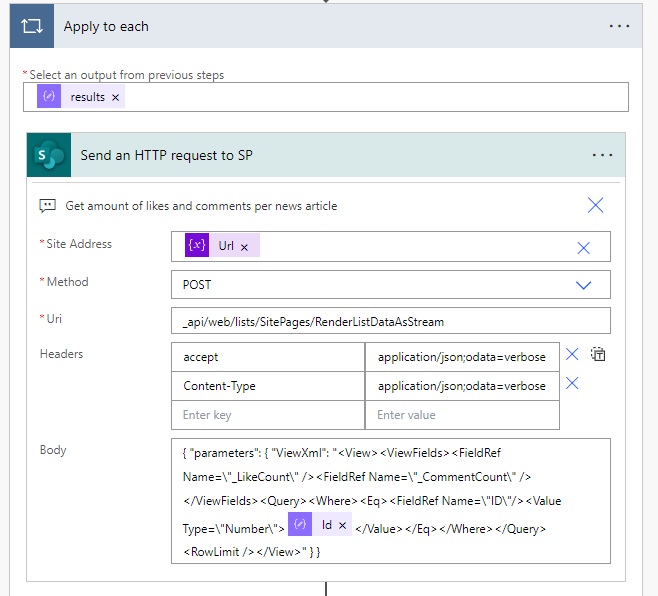
{ "parameters": { "ViewXml": "<View><ViewFields><FieldRef Name=\"_LikeCount\" /><FieldRef Name=\"_CommentCount\" /></ViewFields><Query><Where><Eq><FieldRef Name=\"ID\"/><Value Type=\"Number\">@{items('Apply_to_each')?['ID']}</Value></Eq></Where></Query><RowLimit /></View>" } }
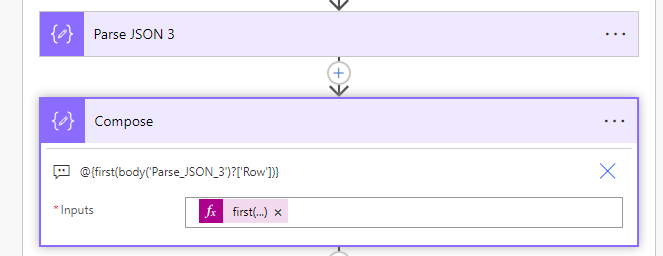
In the body the ID of the newsitem is used to get the _LikeCount and _CommentCount. Those values aren’t available by default. The output of the HTTP request is used in the Parse JSON and using a compose the first result is detracted. Theoretically there can be more results, although we know it’s only one result, because of the unique ID.
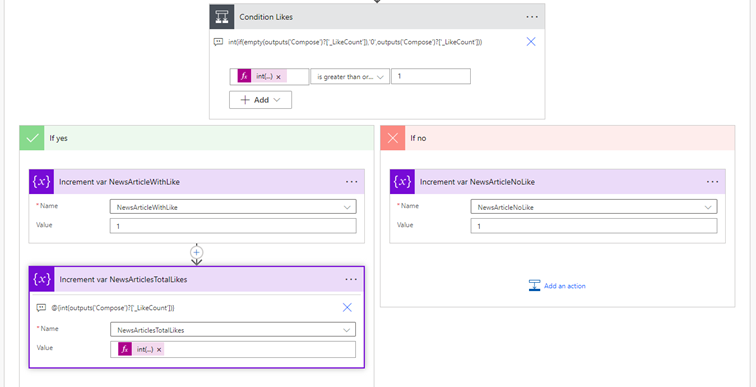
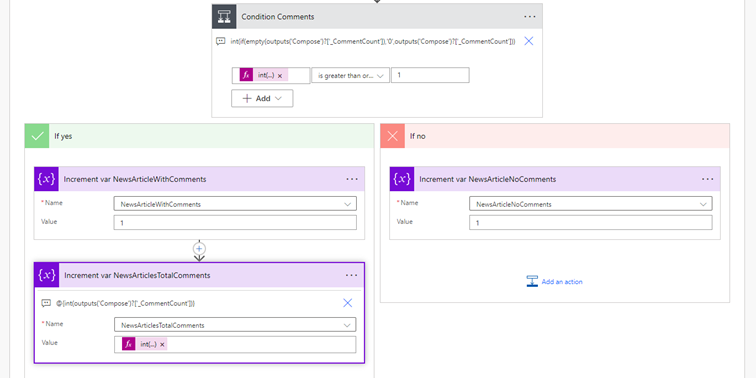
For every newsitem the correct variables will be set. When a newsitem didn’t get a like, the variable ‘NewsArticleNoLike’ will be incremented by 1. When a newsitem has likes, the variable ‘NewsArticleWithLike’ will be incremented by 1 and the total likes (variable NewsArticlesTotalLikes) will be incremented with the amount of likes.
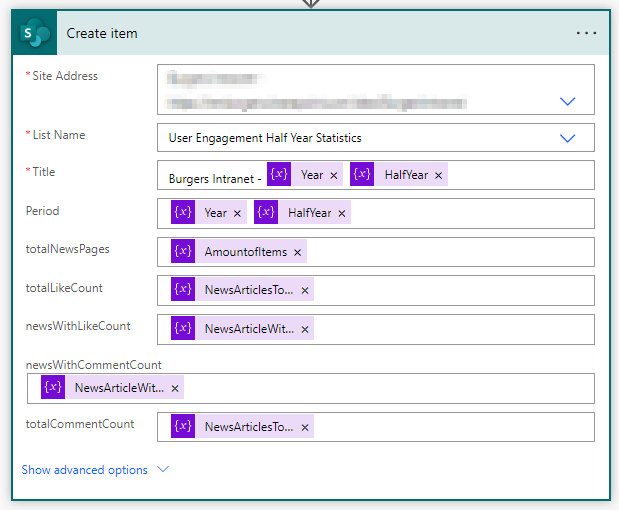
Store values in SharePoint list
The results needs to be stored into a SharePoint list:
The result of the SharePoint list:
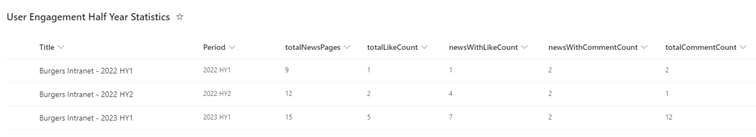
So now you have insight into the half year statistics of your newsitems from your SharePoint Intranet.