
Dynamic horizontal header part 1: static header
Apr 5, 2024 • 4 • 648
Table of contents
In Excel we are quite familiar with a the functionality to freeze a row and a column. In Power App Canvas this can be more challenging. In this blog serie of two blogs a solution for Power Apps will be explained.
- This blog: the setup to create a header and nested galleries
- The second blog shows how to create a dynamic horizontal scrolling header.
Context
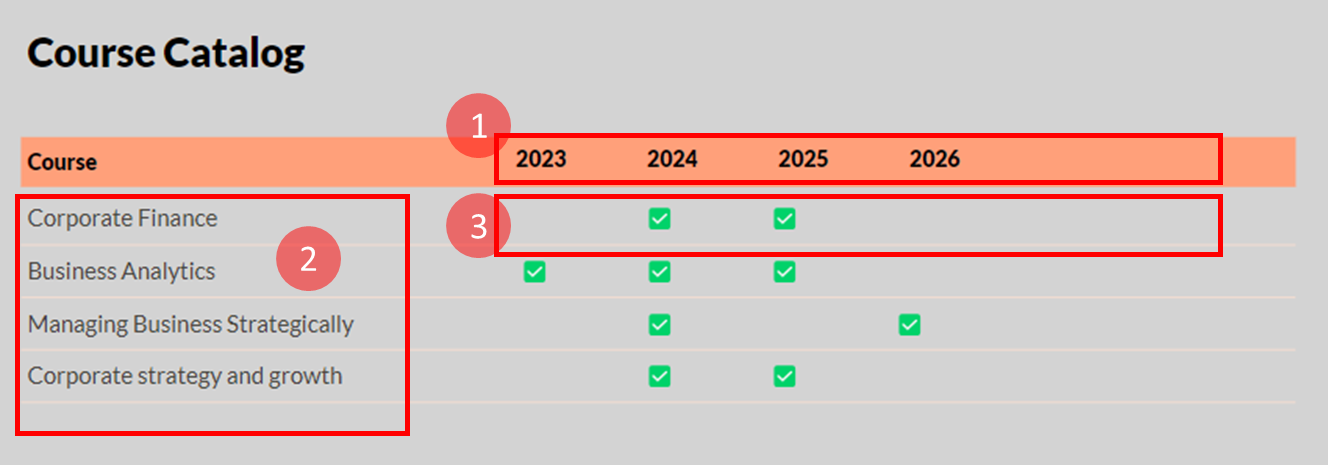
The academic course catalog offers a timeline that illustrates the availability of courses across multiple years, with the main section displaying a horizontal representation of courses available per academic years.
End result
The end results displays the data in a table format to give insights in courses per available per year.

Set up: 1 datasource and 3 galleries
Datasource
There is a table in which for all courses the startdates and years are stored like this:
| Course name | Startdate | Year |
|---|---|---|
| Corporate Finance | 12-12-2023 | 2023 |
| Corporate Finance | 06-12-2024 | 2024 |
| Corporate Finance | 09-12-2024 | 2024 |
| Corporate Finance | 01-12-2025 | 2025 |
| Business Analytics | 02-02-2024 | 2024 |
| Business Analytics | 04-02-2024 | 2024 |
| Business Analytics | 08-02-2024 | 2024 |
| Managing Business Strategically | 14-02-2024 | 2024 |
| Managing Business Strategically | 23-10-2024 | 2024 |
| Managing Business Strategically | 12-02-2026 | 2026 |
3 Galleries
In order to establish the desired layout, three galleries need to be created.
Gallery 1 - Header - Horizontal gallery
In order to establish the horizontal header, it is necessary to incorporate a horizontal gallery displaying the years present in the Courses. Furthermore, apart from configuring the structure to arrange all available years in the correct sequence, the Courses have already been grouped by year value to use in other galleries.
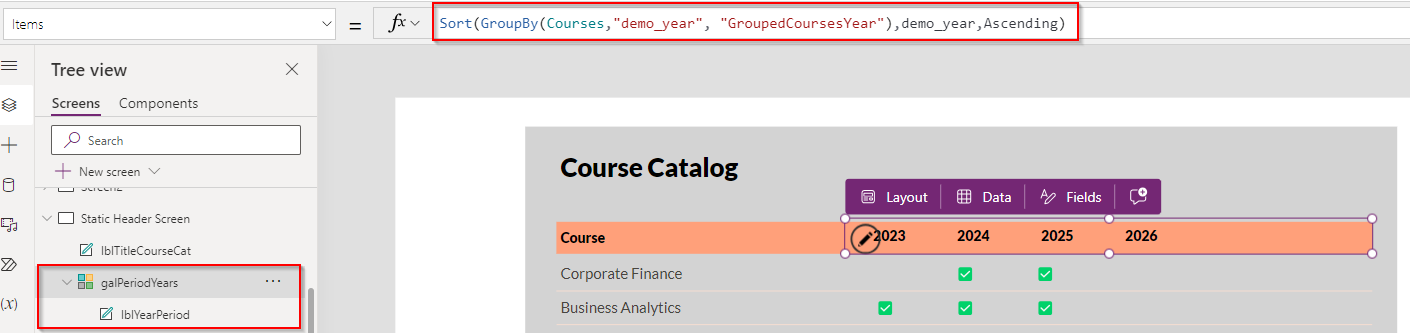
Formula to use in Items:
Sort(GroupBy(Courses,"demo_year", "GroupedCoursesYear"),demo_year,SortOrder.Ascending)
The header gallery only contains one text label which is set to ThisItem.demo_year
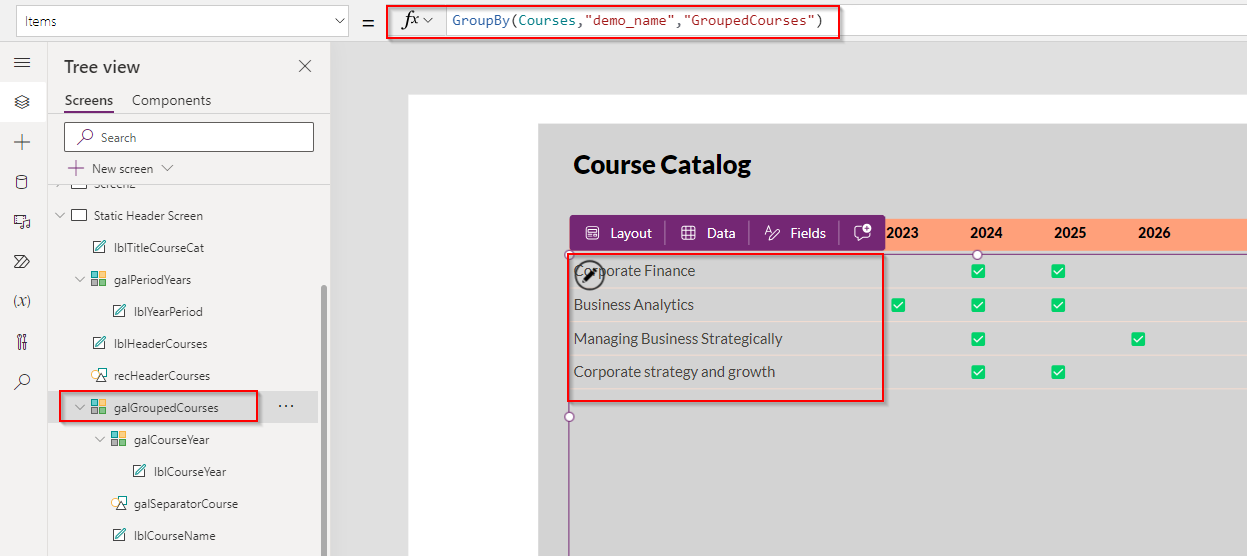
Gallery 2 - Grouped courses
To display the course names add a vertical gallery. In this example the table Courses needs to be loaded and grouped by the name of the course.
In the Items of the gallery the following formula is added:
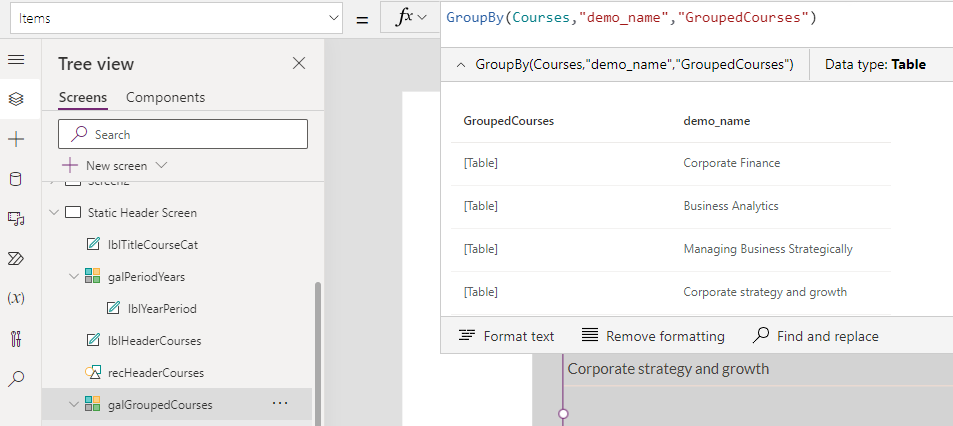
GroupBy(Courses,"demo_name","GroupedCourses")
Example of the result of the formula:
In the gallery a text label represents the course name. In this case the Text value is: ThisItem.demo_name
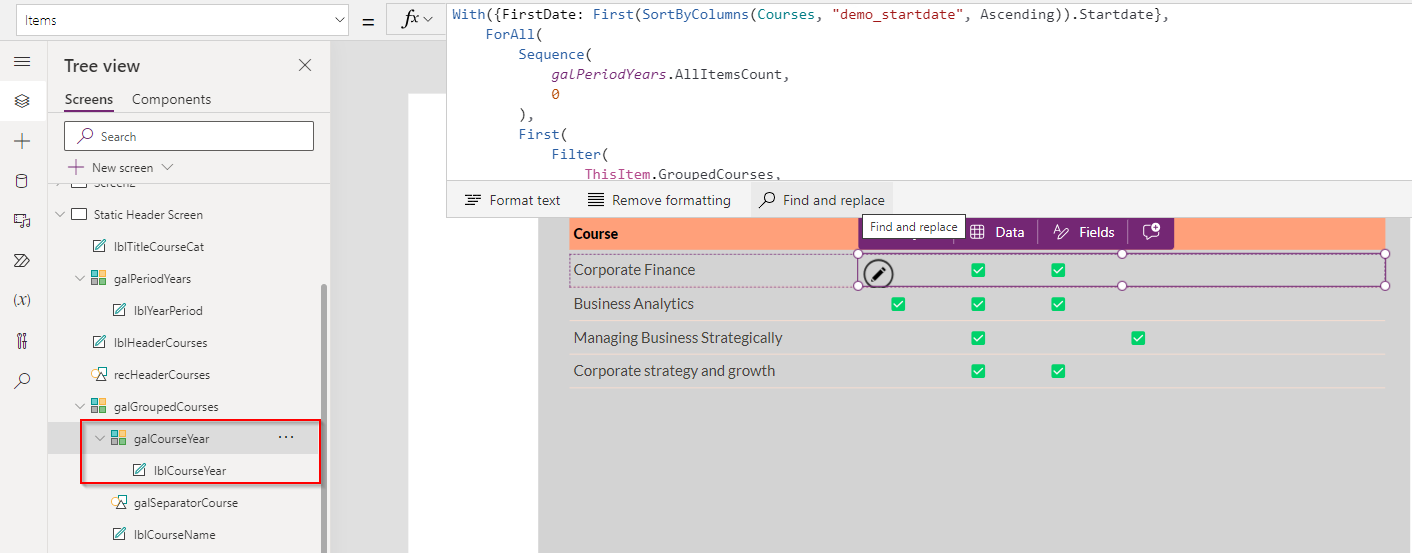
Gallery 3 - Nested gallery
In the gallery galGroupedCourses another gallery needs to be added as a nested gallery.
The Items of the newly created nested gallery needs to be filled using the following formula:
With({FirstDate: First(SortByColumns(Courses, "demo_startdate", SortOrder.Ascending)).Startdate},
    ForAll(
        Sequence(
            galPeriodYears.AllItemsCount,
            0
        ),
        First(
            Filter(
                ThisItem.GroupedCourses,
                Year = Year(
                    DateAdd(
                        FirstDate,
                        Value,
                        TimeUnit.Years
                    )
                )
            )
        )
    )
)
Let’s break down the formula a bit:
The FirstDate is a variable to get the first course in the Course data, to set the minimum date of the Courses.
The Sequence in the ForAll loop represents the number of years to iterate over based on the number of years calculated from the other gallery galPeriodYears.
First(Filter(ThisItem.GroupedCourses, Year = Year(DateAdd(FirstDate, Value, TimeUnit.Years)))):Due to the nested structure ThisItem.GroupedCourses represents current item of GroupedCourses. The Filter part filters the courses to find if this course is available in the year calculated based on the current iteration. To have unique values and be able to set the checkmark the First function retrieves the data of the first course of that year.Year(DateAdd(FirstDate, Value, TimeUnit.Years))calculates the year based on adding the current iteration value (representing years) to the FirstDate obtained earlier. Year function extracts the year part from the resulting date.
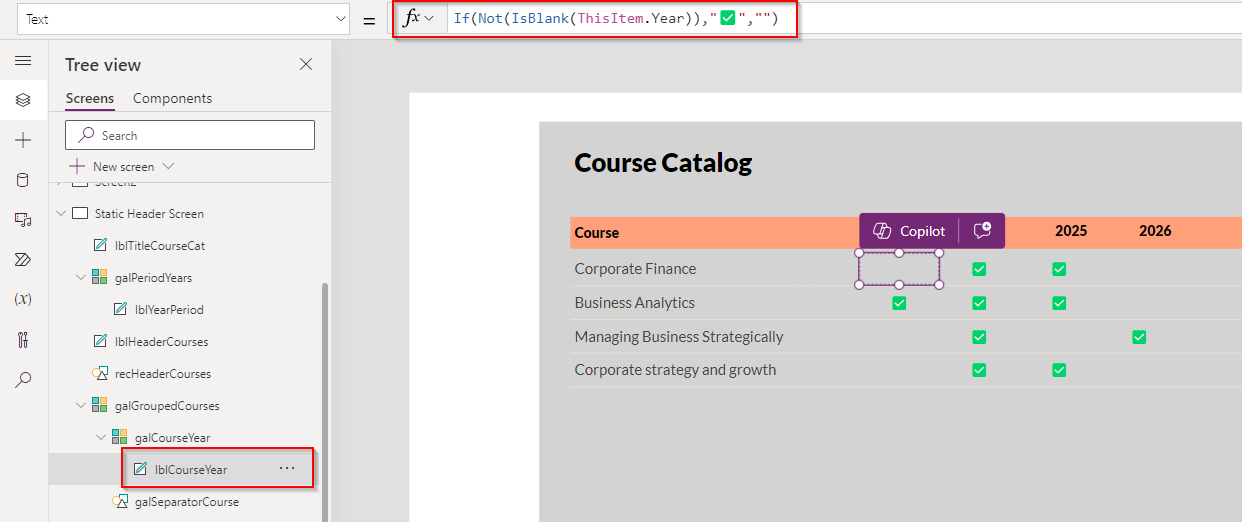
The gallery contains one text label to display the check mark icon if the course is available in that particular year.
If(Not(IsBlank(ThisItem.Startdate)),"✅","")
Wrap up
With this configuration, a single data source suffices to generate meaningful insights and data arrangements through the use of nested galleries. This enhances the adaptability of app design and facilitates data visualization, even in cases with more complex data structures.
The second part of this blog serie will describe a way how to create a moving horizontal header in which you can navigate through the data.