
Dynamic horizontal header part 2: flexible horizontal scrolling
Apr 5, 2024 • 2 • 414
Table of contents
In Excel we are quite familiar with a the functionality to freeze a row and a column. In Power App Canvas this can be more challenging. In this blog serie of two blogs a solution for Power Apps will be explained.
- The first blog the setup to create a header and nested galleries are explained
- This (second) blog shows how to create a dynamic horizontal scrolling header.
Set up
See blog part 1 to have the setup in which the basic of the three galleries are created.
End result
The end results of this blog is to have horizontally header to navigate through the data.

Variable
On the screen OnVisible a variable is set: Set(varStartMonthYear, Now())
Gallery 1: Header - Horizontal gallery
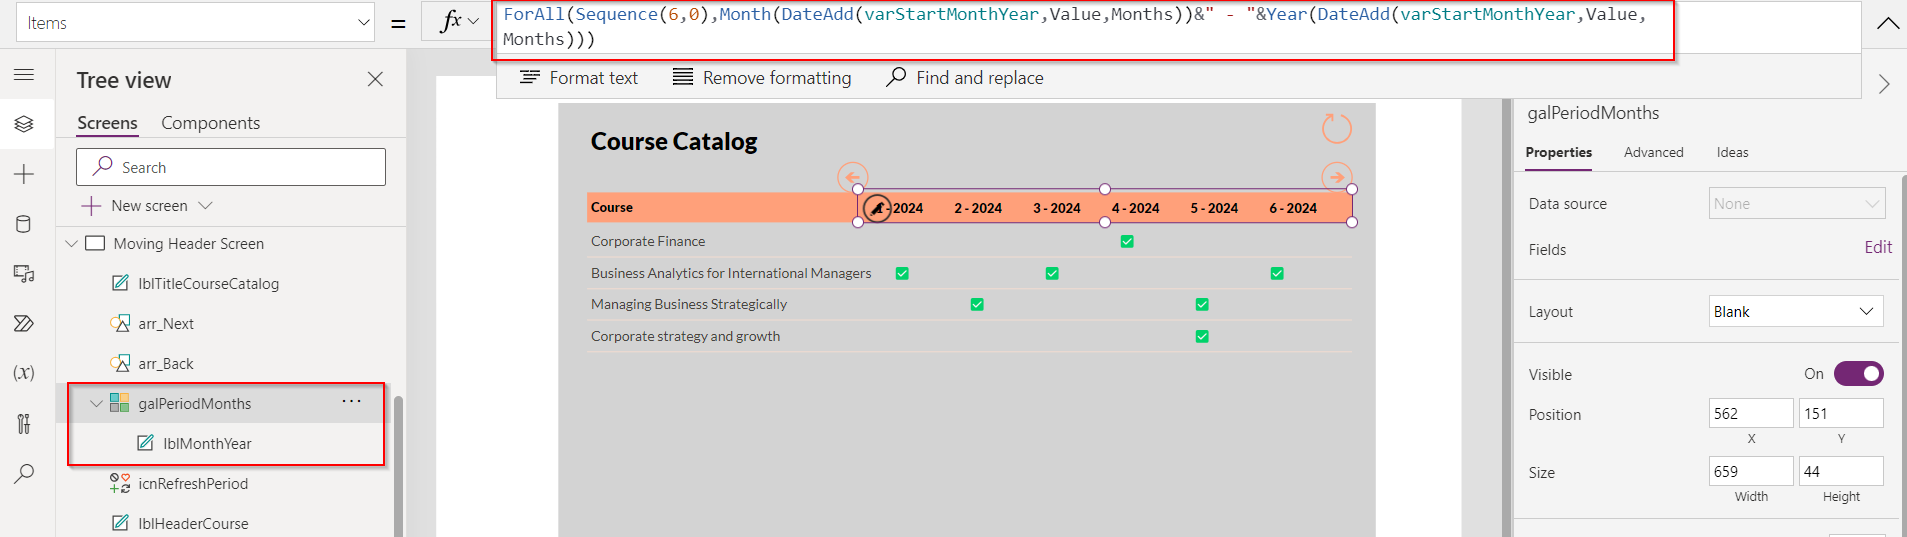
The horizontal gallery needs to contain the month/year for a period of six months. Starting with the next six month for the date of today, set in the variable varStartMonthYear.
ForAll(Sequence(6,0),
    Month(
        DateAdd(
            varStartMonthYear,Value,TimeUnit.Months
            )
        )
    & " - " &
    Year(
        DateAdd(
            varStartMonthYear,Value,TimeUnit.Months)
    )
)
The gallery only contains one text label which is set by ThisItem.Value
To be able to navigate to the previous period of six months and next period of six months, add two buttons on the screen.
On the back arrow button the OnSelect value is:
Set(varStartMonthYear, DateAdd(varStartMonthYear,-6, TimeUnit.Months))
On the next arrow button the OnSelect value is:
Set(varStartMonthYear, DateAdd(varStartMonthYear,6, TimeUnit.Months))
Gallery 2 - Grouped courses
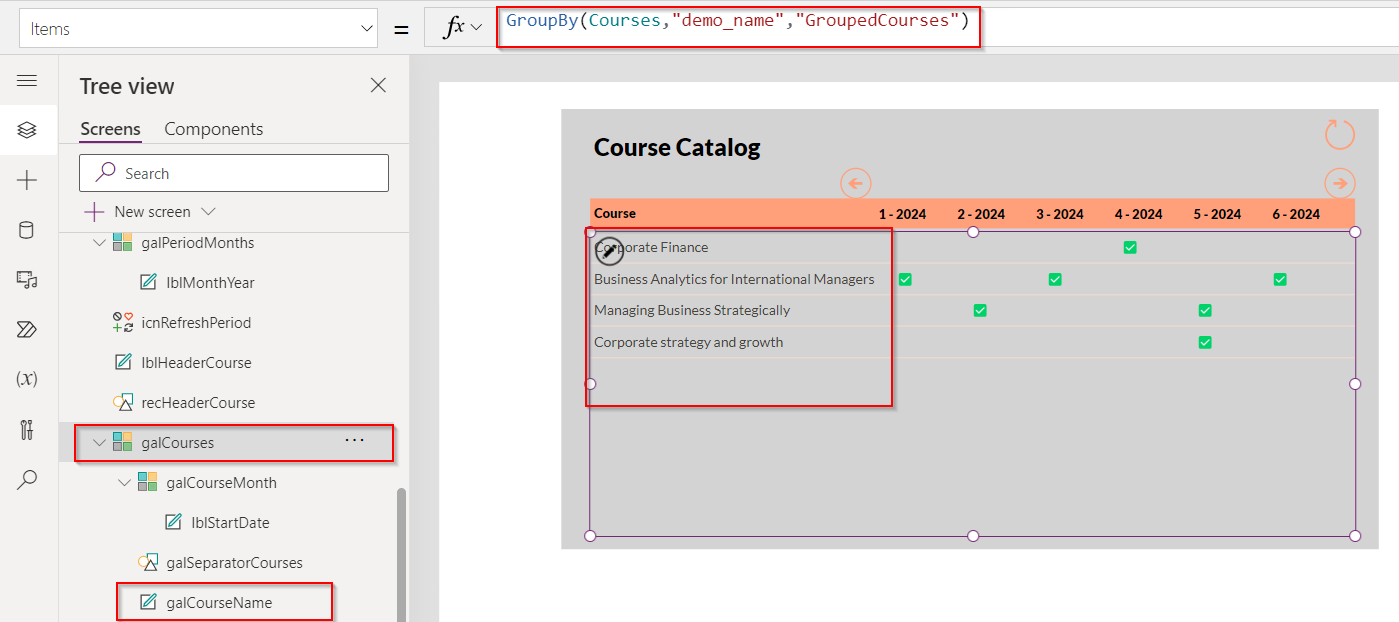
To display the course names add a vertical gallery. In this example the table Courses needs to be loaded and grouped by the name of the course.
In the Items of the gallery the following formula is added:
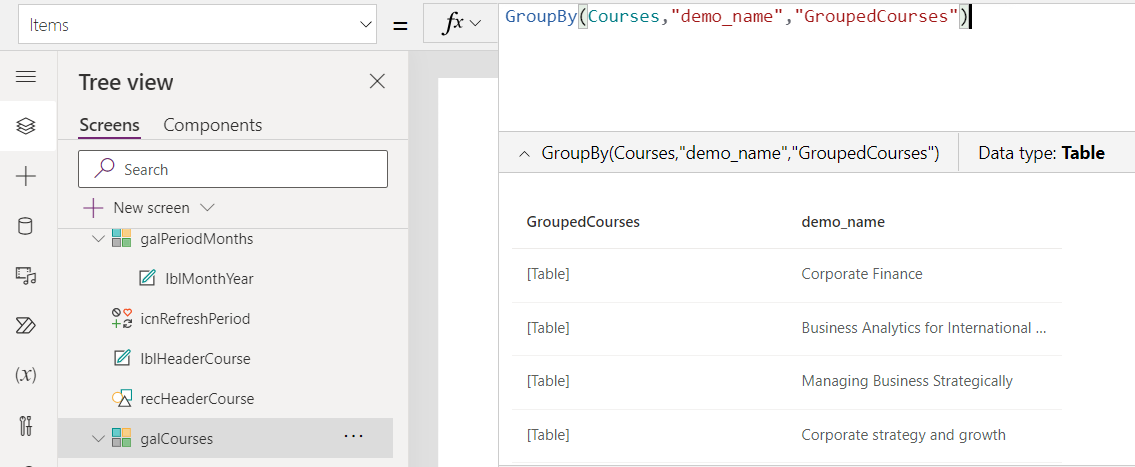
GroupBy(Courses,"demo_name","GroupedCourses")
Example of the result of the formula:
In the gallery a text label represents the course name. In this case the Text value is: ThisItem.demo_name
Gallery 3 - Nested gallery
In the gallery galGroupedCourses another gallery needs to be added as a nested gallery.
The Items of the newly created nested gallery needs to be filled using the following formula:
ForAll(Sequence(6,0),
    First(
        Filter(
            ThisItem.GroupedCourses,
            Year(Startdate) = Year(
                DateAdd(varStartMonthYear,Value,TimeUnit.Months)
            ) && Month(Startdate) = Month(
                DateAdd(varStartMonthYear,Value,TimeUnit.Months)
            )
        )
    )
)
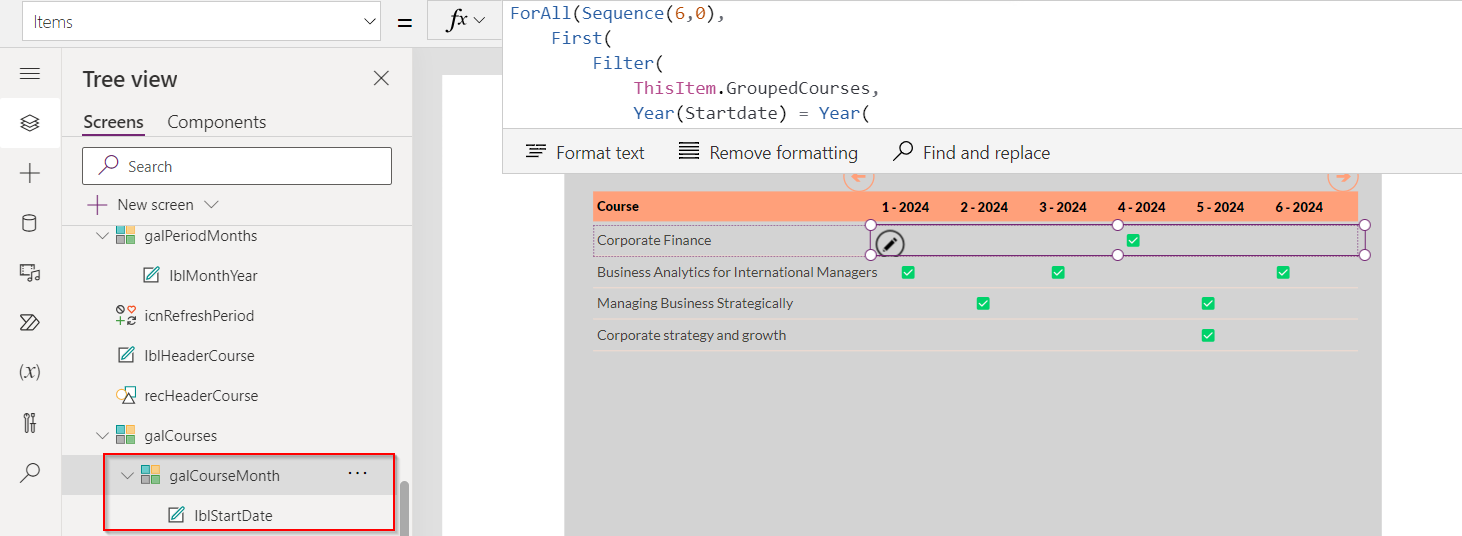
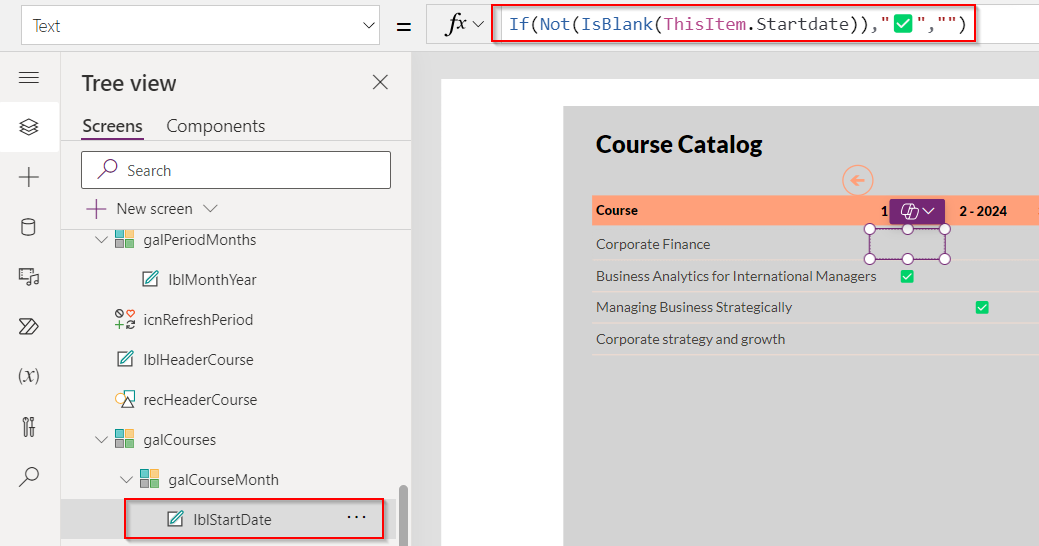
The gallery contains one text label to display the check icon if the course would start in that particular month/year combination.
If(Not(IsBlank(ThisItem.Startdate)),"✅","")
Wrap up
With this configuration, a single data source suffices to generate meaningful insights and data arrangements through the use of nested galleries. This enhances the adaptability of app design and facilitates data visualization, even in cases with more complex data structures.