Make use of the responses: display the survey data of the Forms - part 3
Aug 15, 2023 • 4 • 740
This blog is part of the blog series for Microsoft Forms automation to create automatic update of you question of the week on your SharePoint intranet. The first blog explains how to create a custom connector using the undocumented Microsoft Forms API . The second blog describes how to keep your ‘Question of the week’ based on Microsoft Forms up-to-date .
The result of the first two parts of this blog series is a nice looking SharePoint list which contains all data from the Question of the week. Not only the answer options that could be given, but the results of those questions as well.
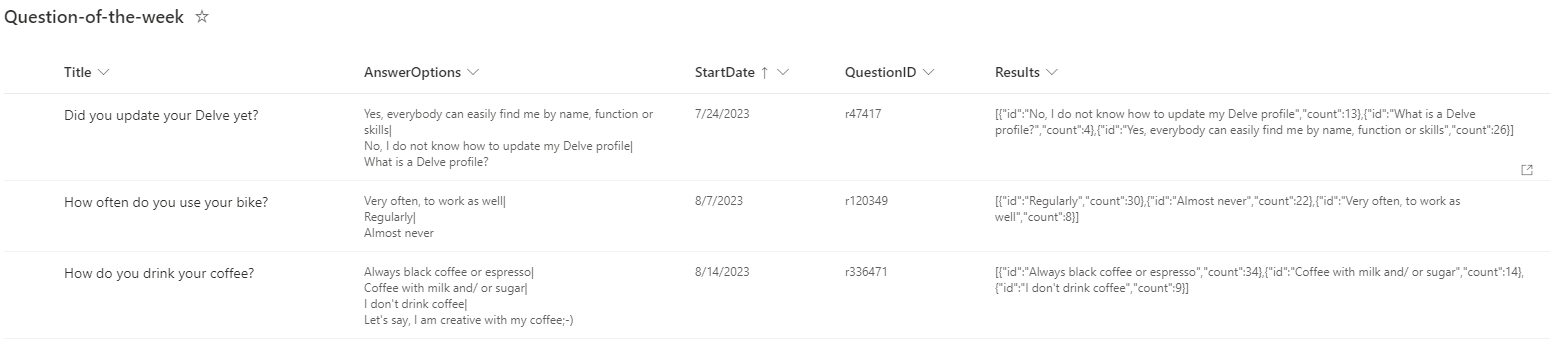
The goal is to make it possible to analyze the answer options. So the AnswerOptions column in SharePoint contains the possible answers which users could select and the Results columns has the count of each option. Only answer options that are chosen are available in that column.
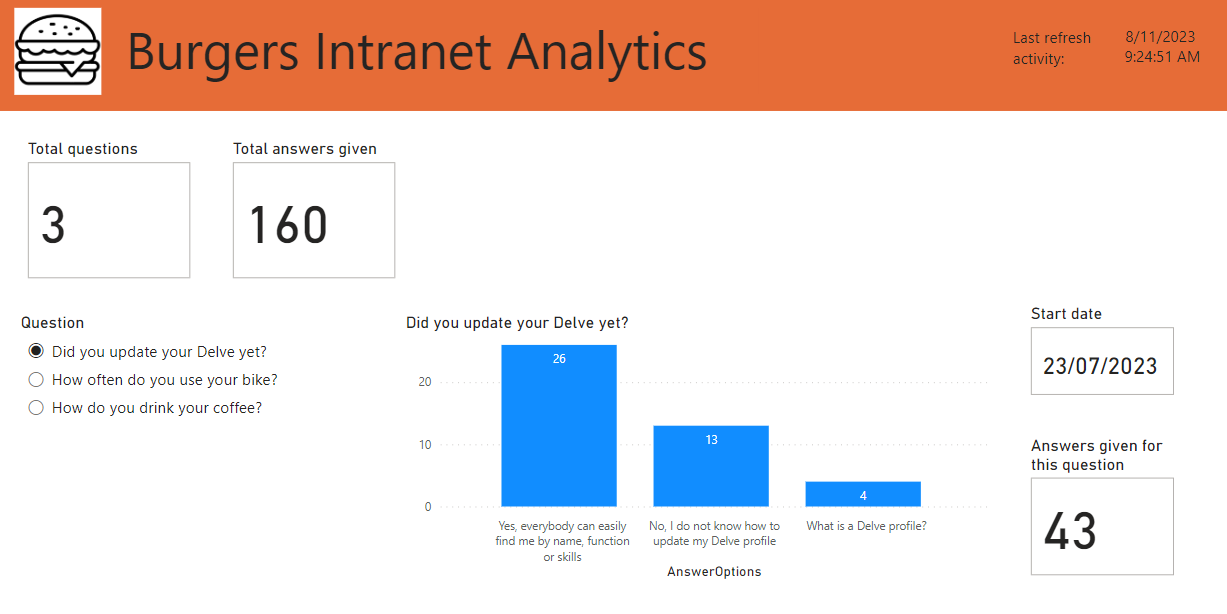
Dashboard
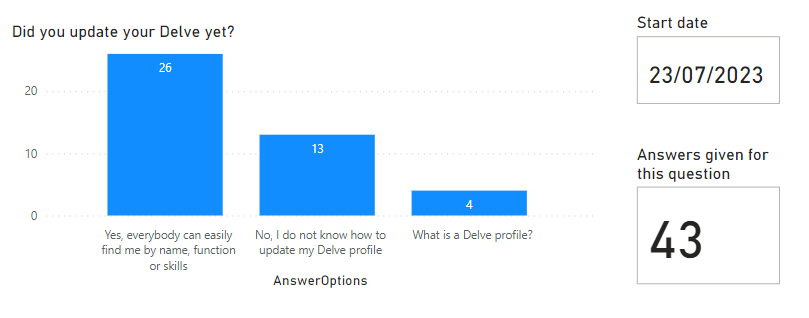
The end result is a Power BI dashboard with the option to select a question and see the answers given with corresponding amount.
Load data
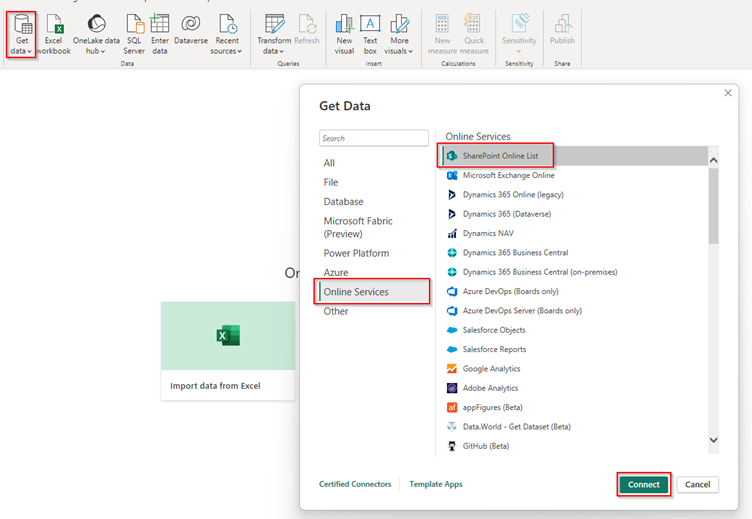
Start Power BI select the option to Get data and select the Online Services -> SharePoint Online List.
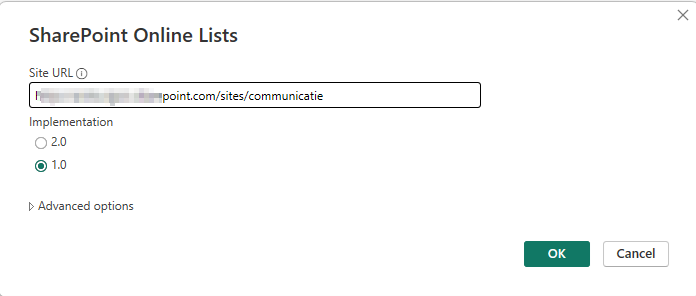
Enter the Site URL and click on OK.
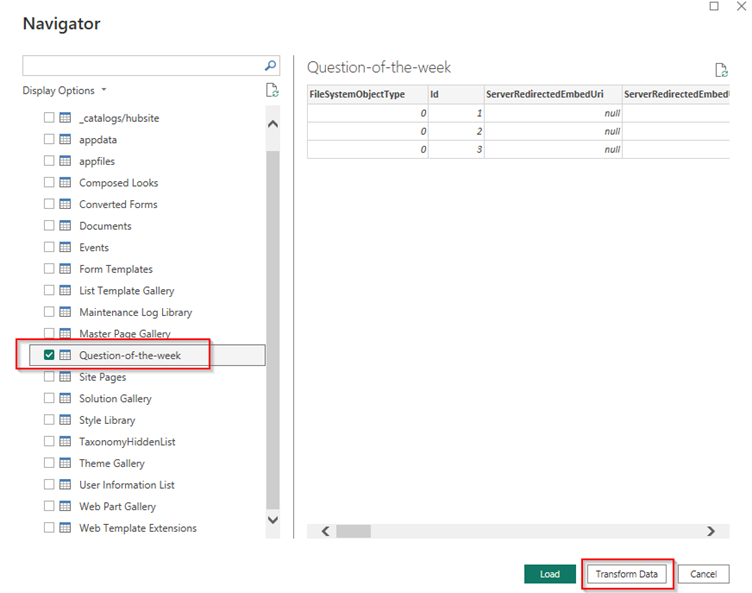
Select the list and click on Transform Data. There is some transformation needed in order to be able to create a proper dashboard.
Transform data
There is some magic needed in this data to be able to use this to visualize.
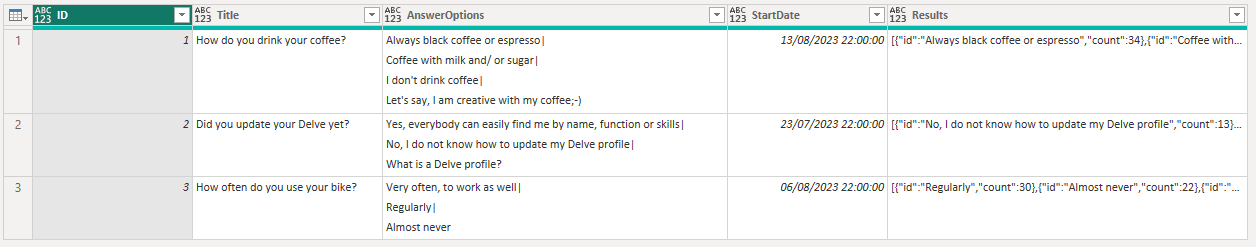
Remove unnecessary columns
To work with relevant data only, remove columns that you don’t need. I only left the columns:
- ID
- Title
- AnswerOptions
- StartDate
- Results
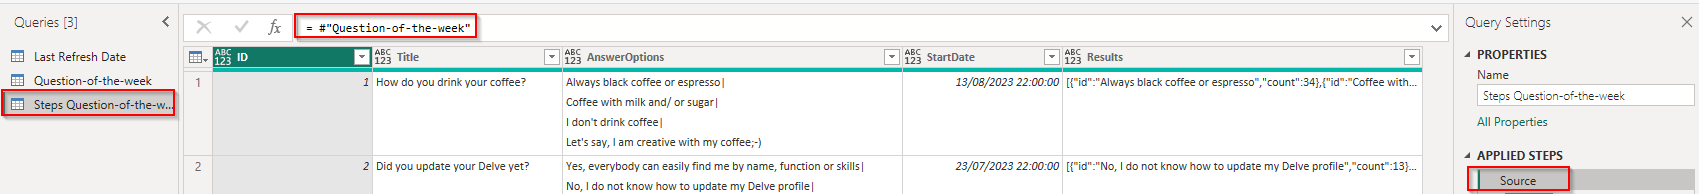
To easily go back to the original list I create a new table with the Question-of-the-week as Source to apply all the steps needed.
Transform Results into JSON
First step was to transform Results column by replacing the empty values with [] and Transform the column in to JSON.
= Table.ReplaceValue(Source,null,"[]",Replacer.ReplaceValue,{"Results"})

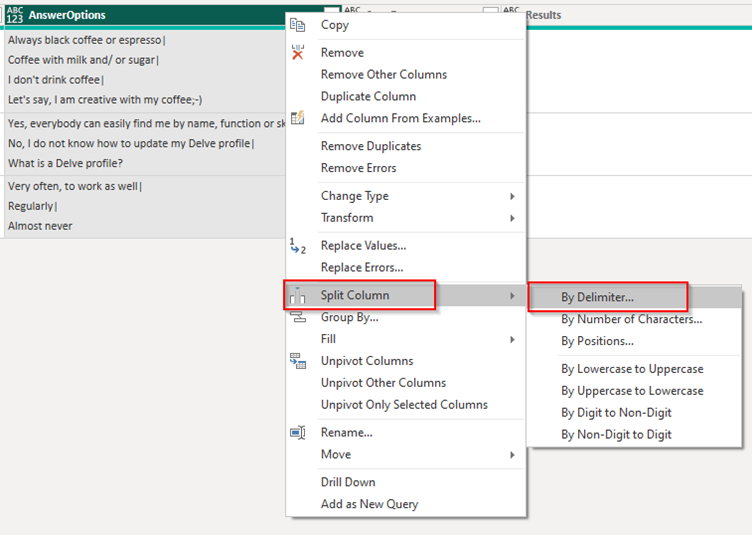
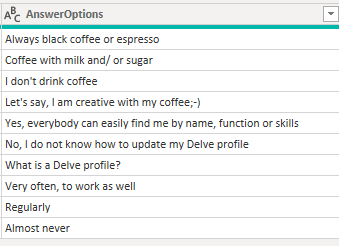
Split by delimiter
Next step is to Split Column of AnswerOptions. This column contains the answer option delimited by |.
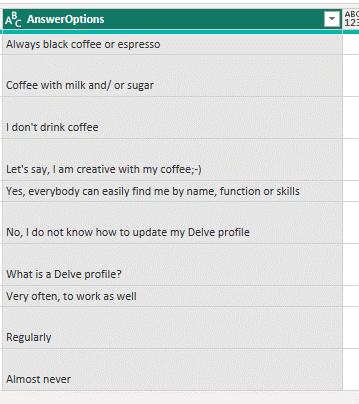
Remove line breaks
The result is all answer options on a different row, but because the answer options are stated on different lines, some values have a line extra which needs to be removed.
Select the column and choose Replace Values and enter #(lf) as Value to Find.
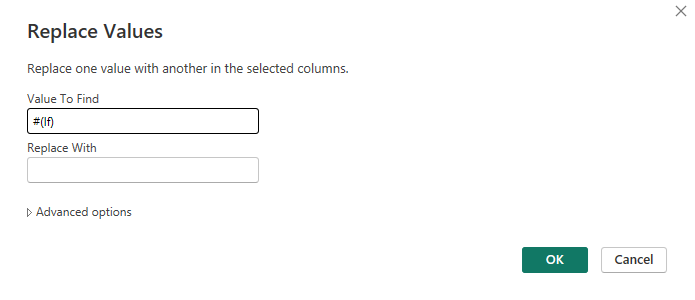
All answer options do have just one line without enters or line breaks.
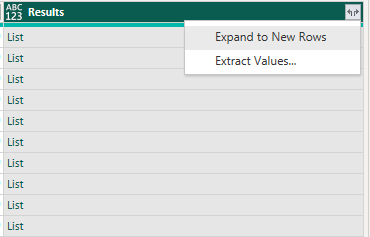
Expand column
Back to the Results column which have the JSON format active, but still holds both id and count value in one column. Expand this column.
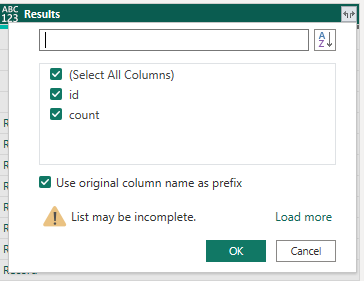
Expand again as you can see, now id and count will be separated columns.
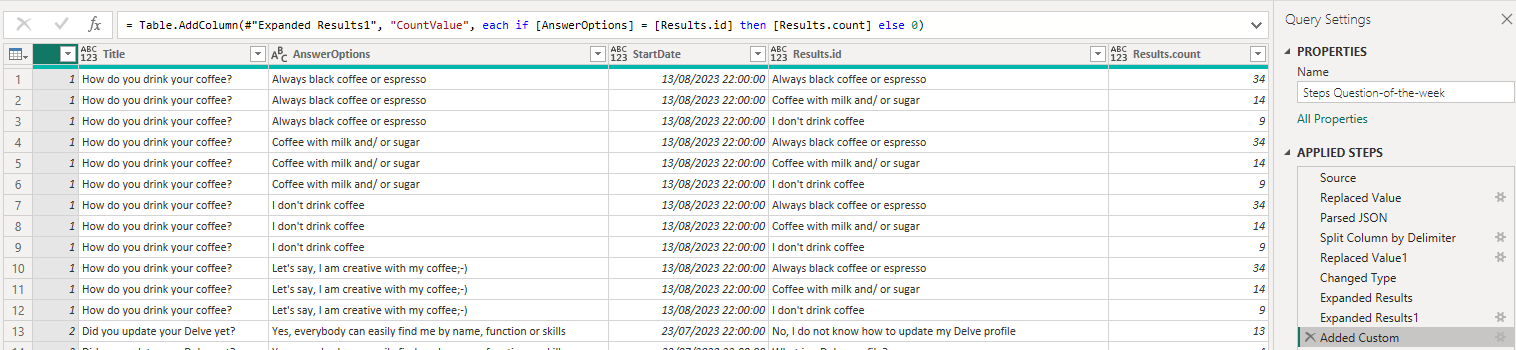
Match column values
The data in the column AnswerOptions doesn’t properly match the Results.id.
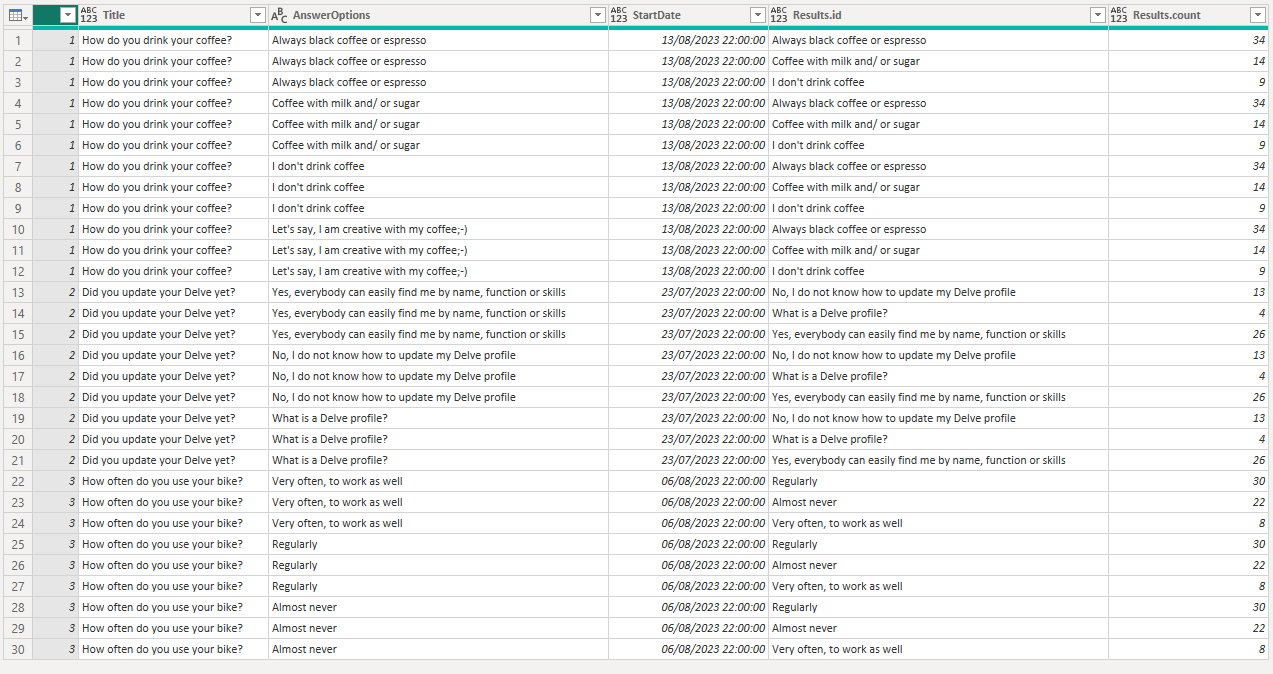
Next step is to have a column with a proper count value. Therefore the value of the AnswerOptions and Results.id needs to be compared. If they have the same value the Results.count value needs to be stored in a separated column otherwise the count needs to be zero.
= Table.AddColumn(#"Expanded Results1", "CountValue", each if [AnswerOptions] = [Results.id] then [Results.count] else 0)
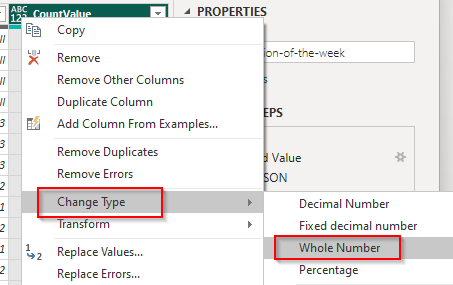
Data type
Last step is to set correct data types.
Set count column as data type Whole Number, so Power BI knows it’s a number instead of a text value.
Set start date as date type.
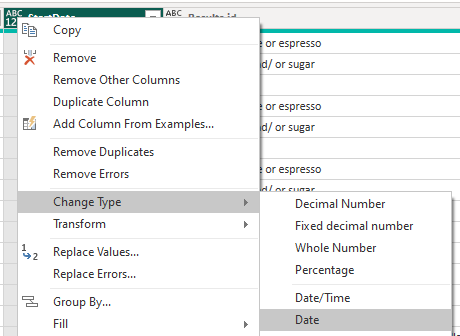
Transformations are done, click on Close & Apply!
Visualize Data
Last phase in creating the dashboard is to visualize the data.
Slicer to select question
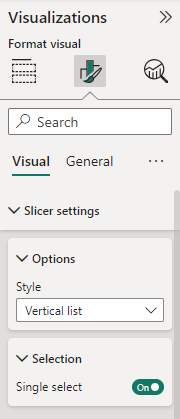
To select the question add a Slicer and select Title as the Field.
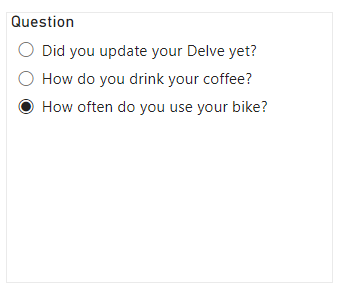

In the visual setting set selection to single select.
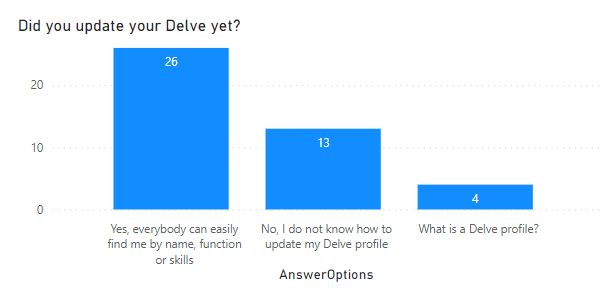
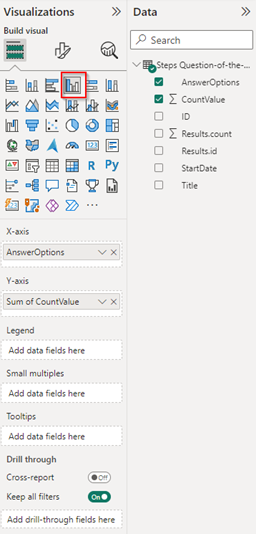
Clustered column chart to display count of answer options
To display the answer options choose a visualization and select the CountValue and AnswerOptions.
Card to show counts of questions and (total) answers given
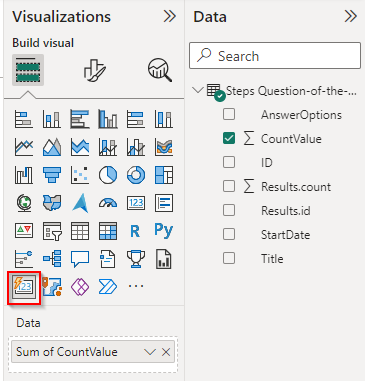
For the card to show answers given for this question select Sum of Count Value.
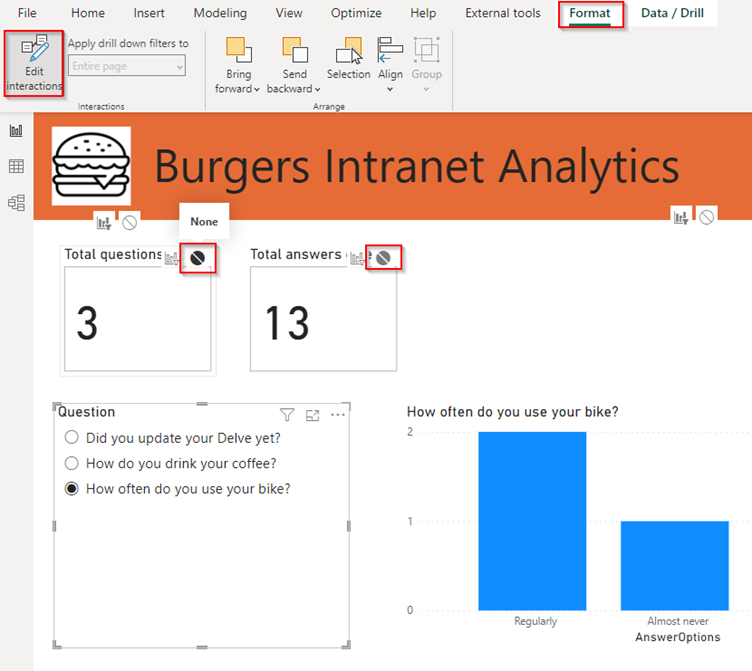
Select count of ID for the card ‘Total questions’. Select Sum of Count Value for the card ‘Total answers given’ To create the cards for Total questions and Total answers given the interactions needs to be correctly, so filtering questions won’t apply to these visuals.
Edit Interactions
Select the Slicer and go to Format -> Edit interactions and select those two visuals, repeat this for the chart visual.
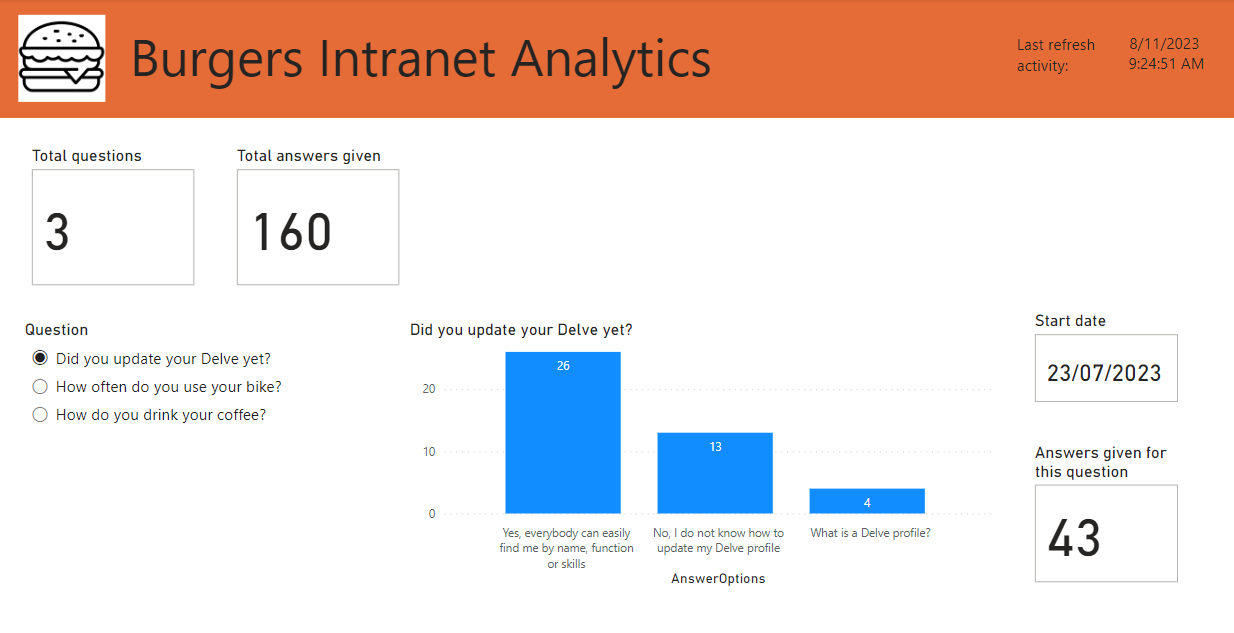
End result - Interactive Dashboard
The end result is an interactive dashboard of which you can see the result of each individual question.